Real time hemodynamic information is closely related to the pathophysiology of vascular diseases. Digital subtraction angiography (DSA) is considered the gold standard for evaluating intracranial vascular disease. Methods based on quantitatively tracking the contrast bolus in DSA images series serves as the primary approach for assessing the flow.
Traditional methods typically employ fixed-rate contrast agent injection and the resulting contrast concentration oscillation is due to the inherent pulsatility of the cardiac cycle. Such method is limited in its robustness in distal vascular regions. Our purpose is to further develop this technique to measure blood flow velocity across the entire vascular cross-section by using an optimized temporally modulated contrast injection protocol.
Video. 1. Unsubtracted DSA image and the corresponding subtracted DSA image.
Fig. 1. The left image shows a DSA system (i.e., a C-arm), and the right image shows a physician manually injecting the contrast agent.
A temporally-modulated contrast injection is generated using a programable syringe pump. This method is benchmarked in a straight 4 mm diameter vascular model with prescribed constant blood flow rate. The blood-mimicking fluid is prepared from glycerol, distilled water, and ethanol. Signal quality was evaluated at various injection frequencies (0.5Hz – 4Hz) using so-called sideband ratio. The velocity profile across the vessel was derived by applying the shifted least-squares algorithm to concentration–time curves measured between pairs of points at different radial positions.
Fig. 2. (a) 0.33 s after contrast injection in the phantom. (b) 0.66 s after contrast injection in the phantom. (c) By tracking the contrast bolus within the vessel, the relationship between image signal and time at each centerline point was analyzed. A 2D image by stacking the time–attenuation curves from all vessel centerline points was obtained.
Fig. 3. According to the time attenuation map of the centerline, (a) The SBR varies along the centerline to optimize the range, the red line indicates 1/4 median value, which is regarded as a threshold to exclude low pulsatile signals. (b) The function of the shifted least squares difference and time shift of any two points on centerline, where the time shift corresponding to the minimum value of difference is defined as the bolus transfer time. (c) Each point along the centerline undergoes a linear fitting process for time shift with respect to the center of the line, where the slope represents the inverse of the velocity.
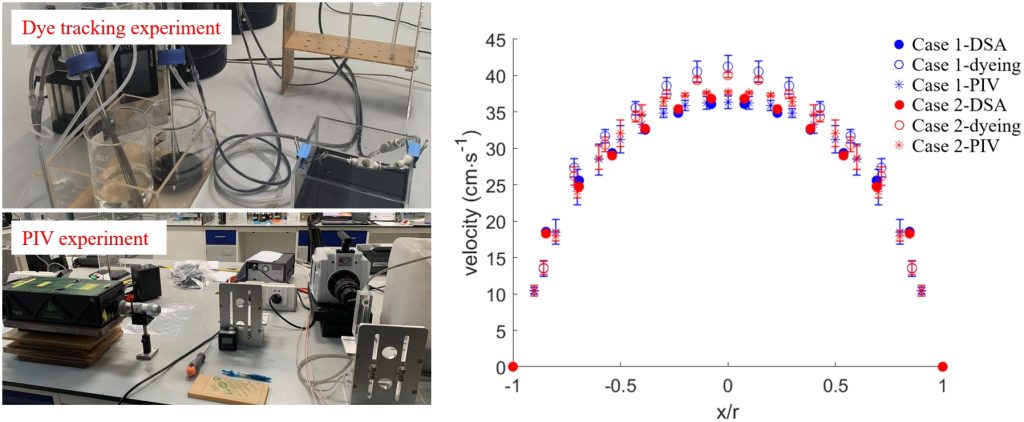
To validate the measurement results of the proposed method, two supplementary measurements, dye tracking and PIV velocimetry, were performed as non-DSA benchmark experiments using a blood-mimicking fluid and a high-speed camera. The acquired radial velocity profiles were integrated to compute the flow rate, which was then compared with the theoretical value. Overall, the mean velocity profile measured by DSA agreed well with the dye-tracking and PIV results, and the maximum flow-rate measurement error was below 10%.
Fig. 4. The left figure shows the setup for the ink-staining experiment and the PIV experiment. The right figure shows the mean velocity profiles and standard deviations obtained from DSA, dye tracking, and PIV within the vessel. The radial distance is normalized by the vessel radius.
Address: 241 Daxue Road, Jinping District, Shantou, Guangdong Province, China
©Guangdong Technion-Israel Institute of Technology 2018
粤ICP备17036470号,版权所有©广东以色列理工学院